Novi XG požarni zid – SOPHOS

Nekrekosljiva zaščita, preprosto in enostaven nadzor.
Vse kar potrebujete v enem paketu – požarni zid, VPN, nadzor, plus dodatno zaščita za končne uporabnike, tablice in telefone. Lastnosti, ki jih enostavno ne boste našli nikjer drugje.
- Full protection suite of network, wireless, IPS, VPN, web, app, email, and web application firewall technology
- Automatically identify and isolate infected systems on your network until they can be cleaned up
- Unprecedented visibility, including user and application risk, with traffic-light style indicators and rich reporting
- Unified policy management that makes powerful policies and rule sets easy and intuitive
- Industry-leading performance at every price point with XG Series hardware appliances utilizing FastPath
KATALOG IZDELKOV PRIMERJAVA MODELOV
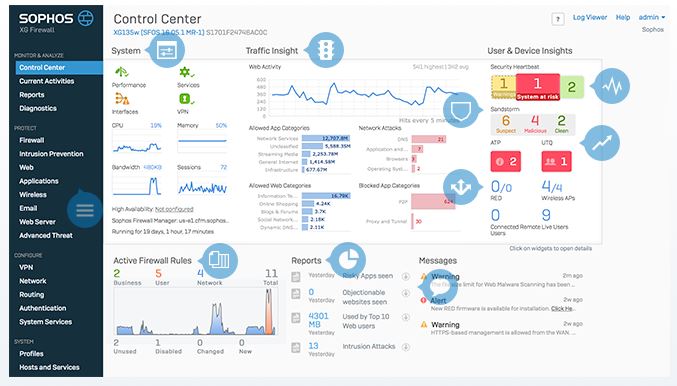
Instant Insights
Sophos XG Firewall provides unprecedented visibility into your network, users, and applications directly from the all-new control center. You also get rich on-box reporting and the option to add Sophos iView for centralized reporting across multiple firewalls.

Upravljanje
![]() The menu items are logically organized, offering quick access to all areas of the system. In fact, you’re never more than two clicks from anywhere.
The menu items are logically organized, offering quick access to all areas of the system. In fact, you’re never more than two clicks from anywhere.
The navigation provides immediate access to monitoring and analysis tools, all protection and policy settings, firewall configuration, and system settings.
Nadzorna plošča
![]()
The system panel displays the real-time status of system performance, services, connections, and other system parameters. Green indicates everything is fine, orange indicates a warning, and red indicates something needs immediate attention.
Each item is clickable to reveal additional details and graphs, as well as helpful system and network tools you can use for troubleshooting purposes such as ping, traceroute, packet capture, command-line access, and much more.
Varnostne politike
![]()
The Active Policies panel right on the control center indicates exactly how many policies you have of each type, how many are unused, disabled, changed, and recently added.
Unused policies are a good indication of policies that may benefit from some housekeeping, as they can present potential openings or vulnerabilities in the network that are no longer required.
Nadzor prometa
![]()
This provides an overview of traffic processed in the last 24 hours, including web activity, allowed and blocked apps and web categories, as well as network attacks.
You can quickly determine when your peak traffic periods are and how effective your policies have been at blocking unwanted activity and traffic.
Sandstorm
![]()
The Sandstorm widget provides an indication of suspect payloads and the sandboxing analysis results. Clicking it provides detailed reporting insights into suspicious file downloads.
The ATP widget provides an immediate indication of the presence of advanced threats on your network like botnets. Clicking it will reveal helpful details about the infected system, including the hostname, IP address, and source of the malicious traffic.
Povezave
![]()
The connections widget shows the status of various connected devices and users, including Remote Ethernet Device (RED) VPN connections, pending and active wireless access points, remote SSL VPN connections, and the current live users count.
Clicking the various components of this widget will take you directly to the respective setup or reporting screen.
Srčni utrip
![]() The Sophos Security Heartbeat widget indicates the health status of all your Sophos Cloud-managed endpoints. If any systems are running unwanted applications or infected, they will show here as yellow or red.
The Sophos Security Heartbeat widget indicates the health status of all your Sophos Cloud-managed endpoints. If any systems are running unwanted applications or infected, they will show here as yellow or red.
Clicking the widget reveals full details on the affected computer, including the user, hostname, IP address, and even the process responsible, enabling you to quickly take action. You can also use Security Heartbeat status in your policies to limit access to network resources for affected systems.
Uprabniki
![]()
Unique to Sophos, User Threat Quotient (UTQ) is an indication of a user’s risk level based on recent web and advanced threat activity. This widget is green when risk levels are low, and turns red when a threshold of risky activity is detected indicating the number of high-risk users.
The score is analyzed over a seven day period, and clicking on it will take you directly to the detailed UTQ report.
Sporočila
![]() The messages panel displays important system notices, warnings, and alerts with blue, yellow, and red icons respectively. Examples include default password warnings, HTTPS and SSH WAN access warnings, registration notifications, license notifications, and firmware updates.
The messages panel displays important system notices, warnings, and alerts with blue, yellow, and red icons respectively. Examples include default password warnings, HTTPS and SSH WAN access warnings, registration notifications, license notifications, and firmware updates.
Click any message to review the full details and take action.
Poročila
![]() This panel displays the top five reports that may have data of interest or require action based on automatic background analysis. Examples include high-risk applications, objectionable websites, web users, intrusion attacks, web server attacks, and more.
This panel displays the top five reports that may have data of interest or require action based on automatic background analysis. Examples include high-risk applications, objectionable websites, web users, intrusion attacks, web server attacks, and more.
Clicking any of the listed reports will open the full report, or you can choose to download a PDF version.